A house sells for $600,000 over asking and it reads like a verdict. Everyone’s fighting. Prices are climbing. You’re already too late.
Except that number measures far less than it seems to.
What it actually measures
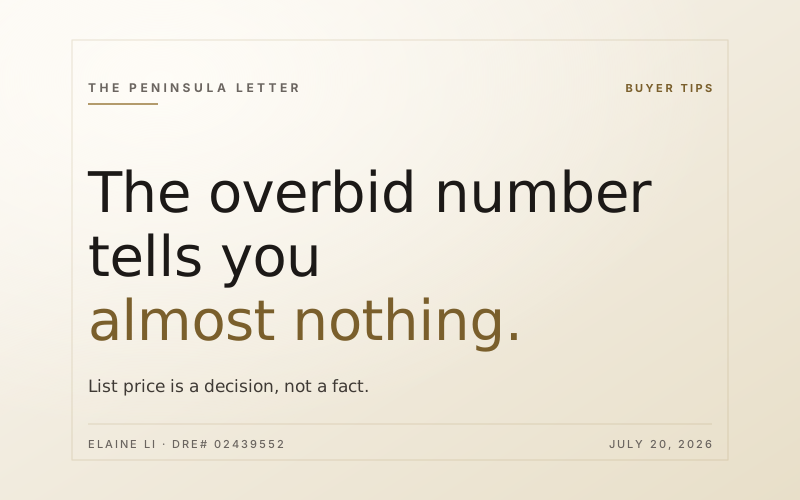
List price is a decision, not a fact. Two nearly identical houses on the same Belmont street can go out $400,000 apart. The underpriced one “overbids” by a spectacular number. The honestly priced one sells at ask. Same buyer pool, same final sale price, two completely different headlines.
So overbid percentage doesn’t measure demand by itself. It measures demand and pricing strategy tangled together, and you can’t pull them apart from the headline alone. In isolation it’s a weak signal — and an easy one to misread in exactly the direction that makes you act.
What to read instead
Days on market, and where a home closes relative to the last comparable sale on that street. Those are harder to manufacture.
If similar homes are closing above where they closed in March, that’s a market moving. If they’re closing at the same number with louder press releases, that’s a pricing strategy.
Why this one bothers me
I spent enough years in revenue reviews to recognize a number that gets quoted more than it gets interrogated. Overbid percentage is one. It makes the best screenshot and the worst decision — buyers see it and either panic-stretch or walk away from a house that was never actually out of reach.
Send me the address
I live in San Carlos and I watch these closings every week. If you saw a number that spooked you, send me the address and I’ll tell you what I actually see in it — the days on market, the comps on that street, and whether the headline is a market or a marketing choice.